Chrome Console Secrets: Mastering Debugging and DevTools
Table of Contents
- The Complete Overview of the Chrome Console
- Historical Background and Evolution
- Core Mechanisms: How It Works
- Key Benefits and Crucial Impact
- Major Advantages
- Comparative Analysis
- Future Trends and Innovations
- Conclusion
- Comprehensive FAQs
- Q: How do I open the Chrome console?
- Q: Can I save console logs for later?
- Q: What’s the difference between `console.log` and `console.debug`?
- Q: How can I debug async code in the console?
- Q: Are there security risks when using the console?
- Q: Can I extend the Chrome console with custom commands?
The Chrome console isn’t just a command line—it’s the backbone of modern web development, a Swiss Army knife for debugging, performance analysis, and real-time experimentation. Behind every seamless website lies a developer who leveraged this tool to troubleshoot errors, profile memory leaks, or even simulate user interactions without writing a single line of code. Its capabilities extend beyond basic logging; it’s where JavaScript meets system-level insights, offering a window into how browsers execute scripts, render pages, and handle network requests.
Yet, many developers treat the Chrome console as an afterthought, relying on it only when errors crash their applications. The truth is far richer: it’s a dynamic environment where you can manipulate the DOM, inspect network traffic, and even prototype entire features on the fly. Whether you’re a seasoned engineer or a curious coder, understanding its depth can transform how you approach frontend challenges. The console isn’t just a tool—it’s a collaborative partner in the debugging process.
For those who’ve only scratched the surface, the Chrome console holds layers of functionality waiting to be explored. From advanced debugging techniques to hidden commands that automate repetitive tasks, its potential is limited only by the developer’s curiosity. Below, we dissect its origins, mechanics, and why it remains indispensable in 2024.
The Complete Overview of the Chrome Console
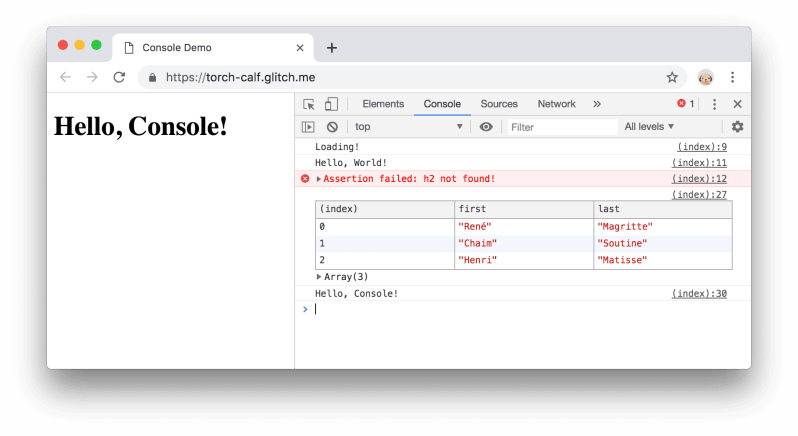
The Chrome console is the interactive terminal embedded within Google Chrome’s Developer Tools, a suite designed to streamline web development. It serves as both a debugging interface and a sandbox for experimenting with JavaScript, CSS, and even network requests. Unlike traditional IDEs, which require separate windows or plugins, the console integrates seamlessly into the browser, allowing developers to inspect live data, modify variables, and test hypotheses without disrupting workflow.At its core, the Chrome console bridges the gap between static code and dynamic execution. It logs messages, errors, and warnings in real time, but its power lies in its ability to execute arbitrary JavaScript commands against the current page’s context. This means you can query the DOM, alter styles, or simulate API responses—all while the page remains active. For teams collaborating on frontend projects, it’s a lifesaver for quick fixes, performance tweaks, and cross-browser compatibility checks.
Historical Background and Evolution
The Chrome console traces its roots to early browser debugging tools, which were rudimentary compared to today’s standards. Firefox pioneered the concept of a built-in JavaScript console in the mid-2000s, but Chrome’s version, introduced in 2008 with the first Developer Tools release, redefined the experience. Google’s focus on speed and usability led to a console that was not only more responsive but also packed with features like syntax highlighting, autocompletion, and contextual help.Over the years, the Chrome console evolved in tandem with web standards. The introduction of ES6 brought new debugging capabilities, such as async stack traces and Promise inspection, while Chrome’s adoption of WebAssembly required deeper integration with performance profiling tools. Today, the console is a product of continuous iteration, with updates aligning with modern frameworks like React and Angular, where debugging state management and lifecycle hooks demands precision.
Core Mechanisms: How It Works
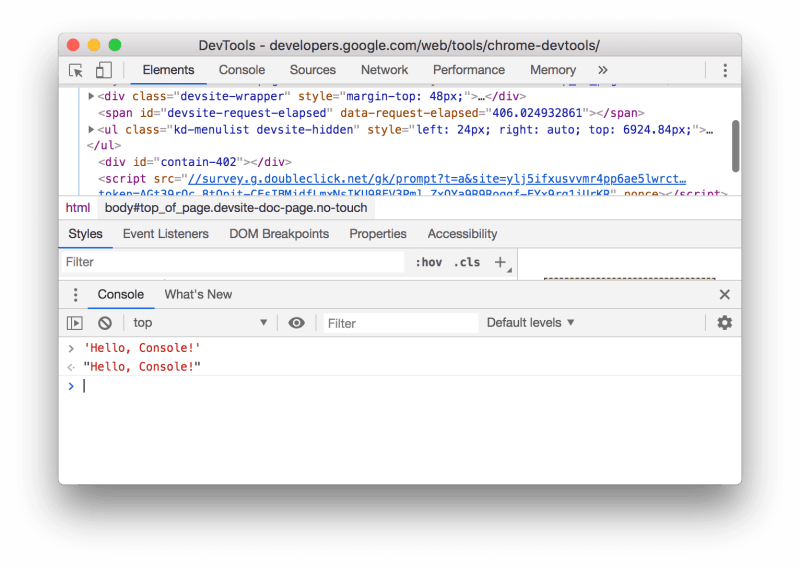
Under the hood, the Chrome console operates as a JavaScript runtime environment tied to the current page’s execution context. When you type a command (e.g., `document.querySelector('header')`), Chrome evaluates it in the same scope as the page’s scripts, meaning you can access global variables, DOM elements, and even browser APIs like `localStorage`. This real-time interaction is possible thanks to Chrome’s V8 engine, which compiles JavaScript to machine code and provides introspection capabilities.The console’s output is generated by logging methods like `console.log()`, but it also captures uncaught exceptions, deprecated API warnings, and network errors. Advanced users can customize its behavior with flags (e.g., `--auto-open-devtools-for-tabs`) or extend it via plugins, though Chrome’s built-in features already cover 90% of debugging needs. The console’s ability to persist state across sessions—thanks to the `$0` through `$4` history variables—further enhances productivity.
Key Benefits and Crucial Impact
The Chrome console isn’t just a debugging tool—it’s a productivity multiplier for developers. In an era where frontend complexity has skyrocketed, its ability to provide instant feedback on code changes is invaluable. Whether you’re debugging a race condition in a React app or optimizing a slow-loading image carousel, the console offers granular control over the execution environment. Its integration with Chrome’s DevTools ecosystem (Network tab, Elements panel, Sources) makes it a central hub for troubleshooting.For teams working on large-scale applications, the Chrome console reduces context-switching. Instead of jumping between IDEs, terminals, and browser tabs, developers can resolve issues in a single interface. This efficiency translates to faster iterations, fewer deployment delays, and a smoother collaboration process. Below, we highlight its most impactful advantages.
"The console is where developers don’t just fix bugs—they understand systems. It’s the difference between reactive and proactive debugging." — Addy Osmani, Chrome DevTools Engineer
Major Advantages
- Real-time Debugging: Instantly log variables, track function calls, and inspect objects without breaking execution. Use `console.trace()` to visualize call stacks or `console.table()` for structured data.
- DOM Manipulation: Modify elements on the fly with `$0.style.background = 'red'` or simulate user events like `$0.click()`. This is critical for testing UI interactions without rewriting code.
- Network Inspection: Intercept and modify HTTP requests using `fetch()` overrides or mock APIs with `console._commandLineAPI.fetchOverride`. Ideal for testing offline modes or API failures.
- Performance Profiling: Measure execution time with `console.time()` or profile memory usage via the Memory tab. Helps identify bottlenecks in SPAs (Single-Page Applications).
- Cross-Browser Testing: Emulate different user agents or device resolutions directly from the console, reducing the need for physical devices or cloud services.
Comparative Analysis
While the Chrome console is the gold standard, other browsers offer competing tools. Below is a side-by-side comparison of key features:| Feature | Chrome Console | Firefox Console | Safari Web Inspector |
|---|---|---|---|
| JavaScript Debugging | Advanced (breakpoints, async stack traces) | Robust (similar to Chrome) | Basic (limited async support) |
| DOM Inspection | Real-time editing with `$()` shortcuts | Manual selection required | Visual DOM tree with CSS overrides |
| Network Tools | Request blocking, HAR export | Request interception, WebSocket support | Basic throttling, no request modification |
| Performance Profiling | CPU, memory, and rendering metrics | CPU and heap snapshots | Limited to CPU throttling |
Future Trends and Innovations
The Chrome console is poised to evolve with WebAssembly’s growing adoption and the rise of AI-assisted debugging. Future updates may include deeper integration with Chrome’s Lighthouse audits, where console commands could trigger performance checks automatically. Additionally, the console’s role in debugging WebGPU applications—where shaders and parallel computing introduce new error types—will expand its scope beyond traditional JavaScript.Long-term, expect more seamless collaboration features, such as shared debugging sessions or AI-generated fixes based on console logs. As browsers adopt WebTransport and other next-gen protocols, the console will likely incorporate tools to inspect these low-level connections, further blurring the line between frontend and backend debugging.
Conclusion
The Chrome console remains the most versatile debugging tool in a developer’s arsenal, offering a blend of simplicity and power that few alternatives match. Its ability to adapt to modern web challenges—from SPAs to WebAssembly—ensures its relevance for years to come. For those who’ve only used it for basic logging, exploring its advanced features can drastically improve workflow efficiency.As web development continues to evolve, mastering the Chrome console isn’t optional—it’s a necessity. Whether you’re optimizing a high-traffic site or prototyping a new feature, its real-time insights and interactive capabilities provide an edge. The console isn’t just a tool; it’s a partner in building the web.
Comprehensive FAQs
Q: How do I open the Chrome console?
A: Press F12 or Ctrl+Shift+I (Windows/Linux) / Cmd+Opt+I (Mac), then select the "Console" tab. Alternatively, right-click on a page and choose "Inspect" to open DevTools, then navigate to the console.
Q: Can I save console logs for later?
A: No, console logs are session-specific and clear when the tab closes. To preserve logs, redirect them to a file using console.log.apply(console, arguments).toString() or use a logging library like winston for Node.js integration.
Q: What’s the difference between `console.log` and `console.debug`?
A: Both display messages, but console.debug is filtered out by default in the console’s dropdown (unless "Verbose" is enabled). Use debug for internal logs and log for user-facing output.
Q: How can I debug async code in the console?
A: Use console.trace() to log async stack traces or set breakpoints in the "Sources" tab. For Promises, wrap them in Promise.resolve().then(() => { ... }) to pause execution.
Q: Are there security risks when using the console?
A: Yes. Malicious scripts can inject code via the console, modify DOM elements, or steal cookies. Always avoid pasting untrusted code and use Chrome’s "Content Security Policy" (CSP) headers to restrict console access in production.
Q: Can I extend the Chrome console with custom commands?
A: Yes. Use console._commandLineAPI to add custom methods (e.g., console.myCustomFn = () => alert('Hello!')). For persistent commands, create a Chrome extension or use a bookmarklet to inject scripts.
Leave a Comment
Comments are moderated before appearing. The data you submit is processed according to the Privacy Policy of versiliasolutions.oneagency.co.